
Run:
Forecast Hour
Valid:
Parameter
Upper-Air: Height, Wind, Temperature
Height and Wind
Height Tendency
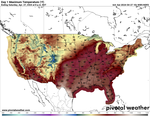
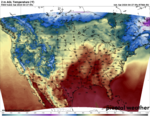
Temperature and Wind
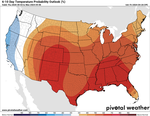
Anomalies
Surface and Precipitation
Surface
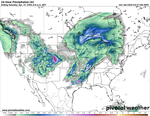
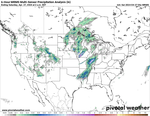
Quantitative Precipitation
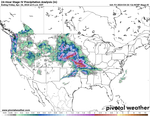
Integrated Moisture and Satellite
Anomalies
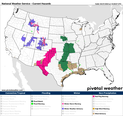
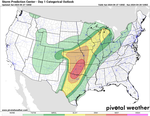
Severe Weather
Instability
Wind Shear
Winter Weather
Cursor readout
Click for sounding
Zoom menu
previous forecast hour
<
next forecast hour
>
previous run
[
next run
]
toggle readout
r
Model ►
Zoom ►
Animation ►
